
Measuring Productivity: PowerShell & Power BI
Continuing in this series on measuring productivity, we’ve covered the importance of tracking and measuring, the Microsoft Adoption Score, and M365 reporting in the Admin Center. For this post, we’ll cover some additional tools for deeper, targeted analysis.
Microsoft 365’s native analytics capabilities provide valuable insights into platform usage. However, for a deeper, more personalized analysis of your organization’s digital productivity, PowerShell and Power BI offer an enhanced level of granularity and customization.
PowerShell commands allow for extraction of granular data from Microsoft 365, while Power BI can translate that data into visually compelling reports and dashboards. This combination enables comprehensive analytics on user activity, data usage, and collaboration patterns, allowing you to delve deeper into productivity metrics and make data-driven decisions.
PowerShell and Microsoft 365
PowerShell is a task automation and configuration management framework from Microsoft, consisting of a command-line shell and scripting language. With PowerShell, you can manage Microsoft 365 at a granular level. It offers a suite of commands, known as “cmdlets,” for controlling and automating the administration of the Microsoft 365 environment.
By using PowerShell, IT administrators can extract raw usage and activity data from Microsoft 365 that might not be directly accessible or visible through the Admin Center. This can range from user-level data, such as a detailed breakdown of an individual’s actions within an application, to more complex information, like specific interactions within Teams or SharePoint.

Power BI for data visualization
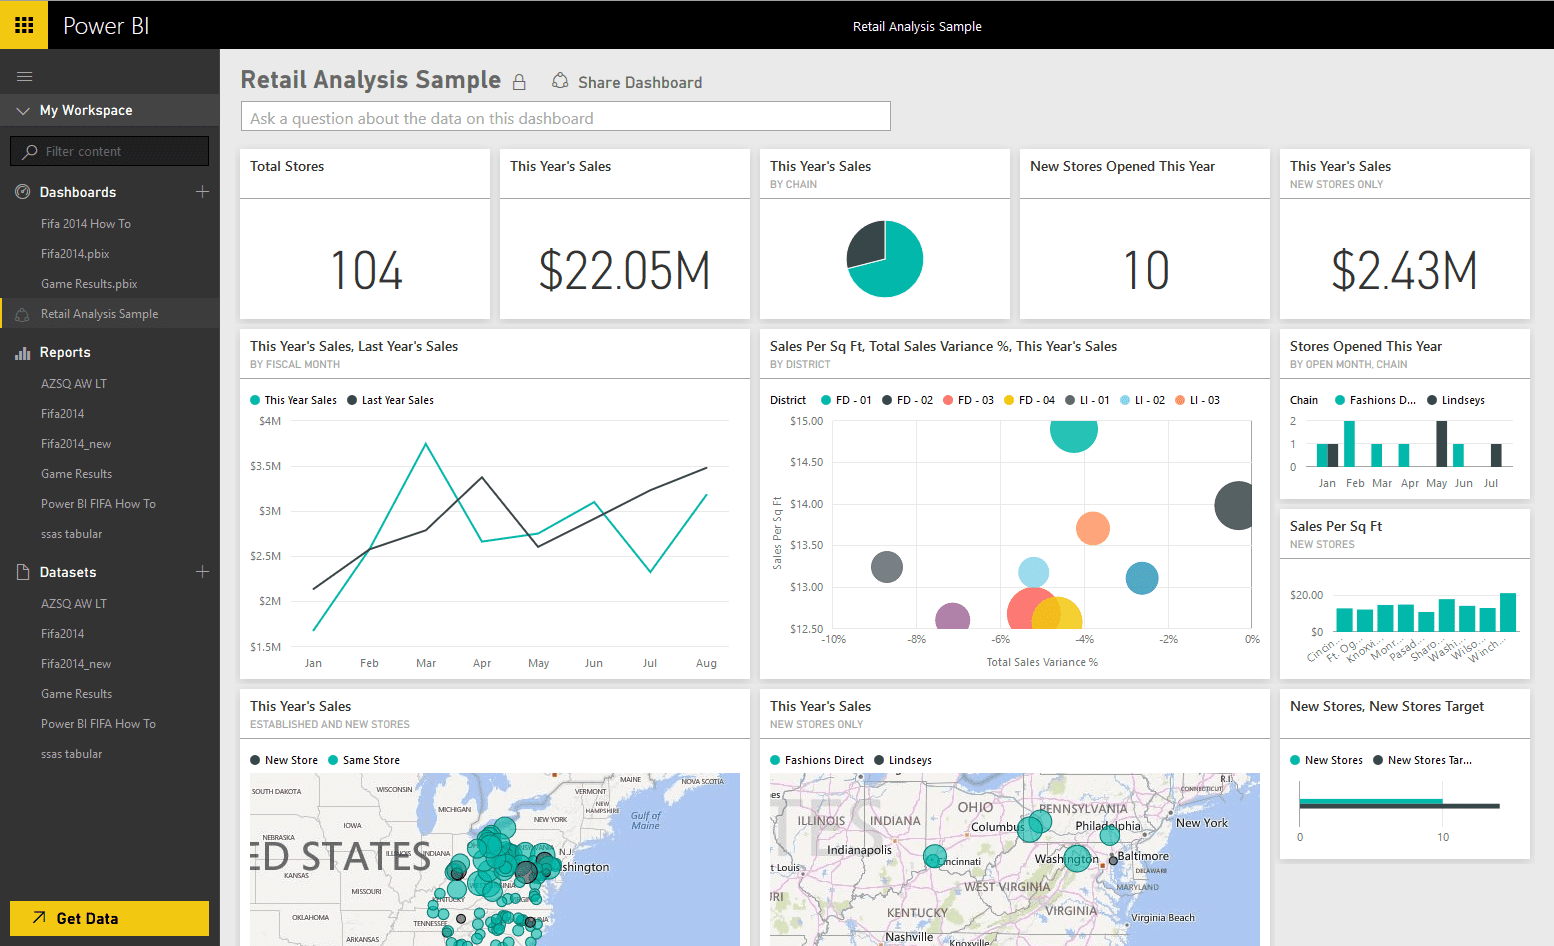
Power BI is Microsoft’s data visualization and business intelligence tool, designed to convert raw data into meaningful insights through interactive visualizations. Once the raw data from Microsoft 365 has been extracted using PowerShell, it can be imported into Power BI. Here, it can be manipulated, analyzed, and transformed into a variety of visually appealing reports and dashboards.
Power BI provides an intuitive interface where you can drag and drop different fields to create charts, graphs, maps, and more. It supports filtering and drill-downs, allowing users to explore data at various levels of detail. Furthermore, reports and dashboards in Power BI can be easily shared among stakeholders, promoting data-driven decision-making across the organization.
Harnessing PowerShell and Power BI for comprehensive analytics
The combination of PowerShell’s data extraction capabilities and Power BI’s visualization prowess allows for comprehensive analytics on Microsoft 365 usage. This duo can reveal in-depth insights into user activity, data usage, and collaboration patterns within your organization.
For instance, you might use PowerShell to extract data about SharePoint site usage, then use Power BI to visualize this data, revealing trends in site visits, popular content, and peak usage times. Such insights could then drive decisions about resource allocation, training needs, or policy updates.
Although Microsoft 365’s inherent analytics offer meaningful observations, utilizing the capabilities of PowerShell and Power BI can furnish a more intricate, personalized comprehension of your organization’s digital productivity. By employing these tools, enterprises can probe further into their productivity metrics and make enlightened, data-based decisions to enhance productivity and operational excellence.